Home Prices By Quarter
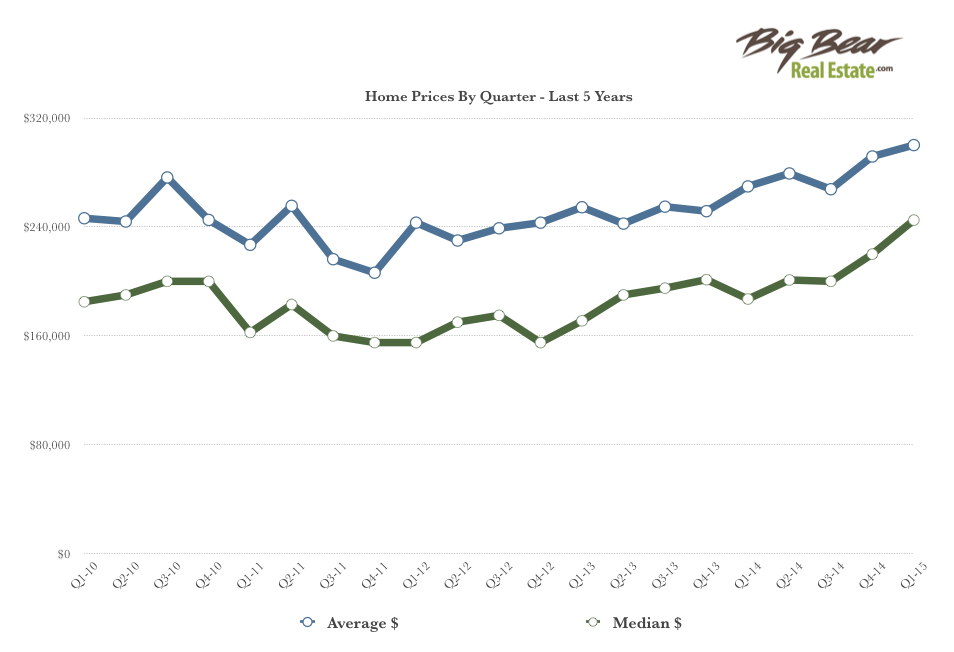
The graph below shows average and median home prices in each quarter since Q1 2010. We can see that home prices have risen fairly steadily over the last couple of years. It is also interesting to note that the median home price has increased more in the first quarter of 2015 than in any other quarter over the last 5 years.

Market Wide Summary
The median sales price of single family homes in March decreased by 5% compared to the previous month though is 23% higher than it was in March of last year. Average sales price is up 5% from last month and average price per square foot continues to rise.

List Price vs. Sale Price and Days on Market
88 homes sold in March and went for 95% of the asking price after 113 days on market on average, down from 97% and 139 DOM in February and up from 93% and 108 DOM in March of last year.
Big Bear Inventory Trends
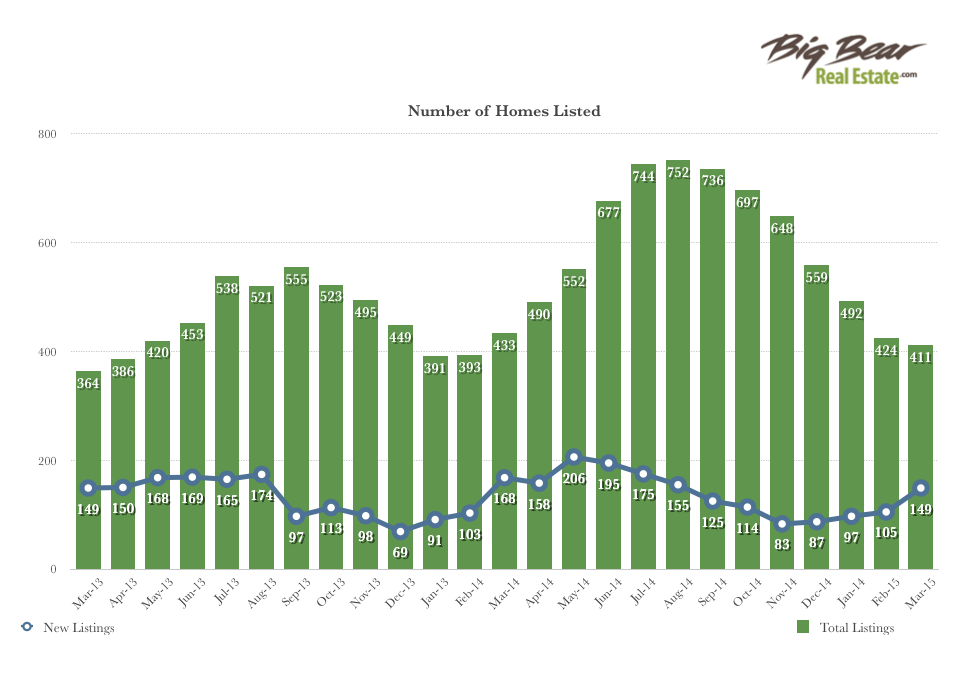
Inventory in March was down 3% versus the prior month, though was down 5% versus last year. The current inventory is 45% lower than it was in August, and is less than half of what it was 5 years ago. As we head into the spring season, we are seeing more new listings coming on the market. 149 homes were listed in March compared to 105 new listings in February. Distressed listings, bank-owned and short sales, account for less than 3% of the current inventory.


Leave a Reply