Market Wide Summary
Big Bear Real Estate market snapshot for the month of September 2016
The median sales price of single family homes in September decreased by 7% compared to the previous month, though year-to-date was 15% above where it was January-September of last year. Average sales price was down 5% from last month, and was 7% higher YTD compared to what it was over the first 3 quarters of 2015.

List Price vs. Sale Price and Days on Market
Properties sold in September went for 97% of the asking price; same as in August. The average list to sell price ratio is also at 97% year-to-date, the same as it was over the first 9 months of 2016. Average marketing time in September was 99 days, up from 85 days on market over the prior month.
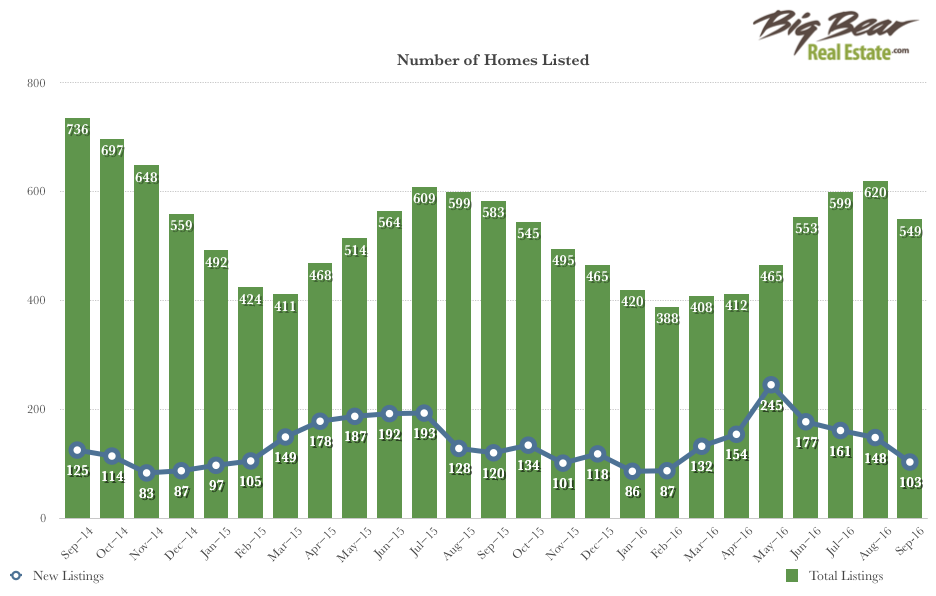
Big Bear Inventory Trends
Inventory was down month over month, which is typical as we head into fall. The total number of homes on the market in September was down nearly 11% versus the prior month, though was 6% lower compared to September 2015. There were also 30% fewer new listings in September than in August. The average inventory year-to-date is 5% lower than it was Jan-Sept 2015. Distressed listings, bank-owned and short sales, account for about 1% of the current inventory.

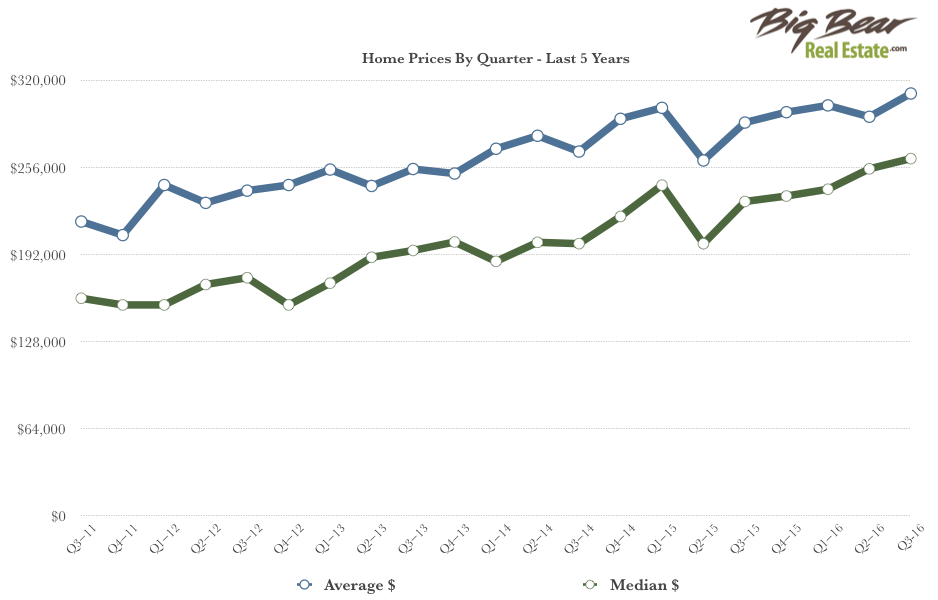
Home Prices By Quarter
The graph below shows average and median home prices in each quarter since Q3 2011. We can see that home prices have risen fairly steadily over the last 5 years.


Leave a Reply