
Big Bear Real Estate Market Stats for the month of January 2020
Market Wide Summary
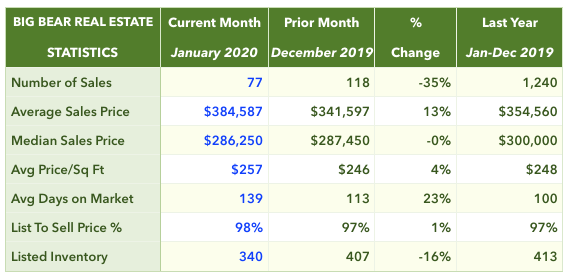
The average sales price of single family homes in Big Bear in January was 13% higher than that of the previous month and the median sales price stayed virtually flat. Average sale price was about 8% higher in January compared to the average sale price over all of 2019.
List Price vs. Sale Price and Days on Market
Properties sold in January went for 98% of the asking price after 139 days on market on average, compared to 97% and 113 DOM in December. The list-to-sell price ratio was 97% on average over all of 2019.
Big Bear Inventory Trends
Total inventory* was down 16% month over month, though there were 39 more new listings in January than in December. The total number of homes on the market last month was about 13% lower than it was in January of last year.
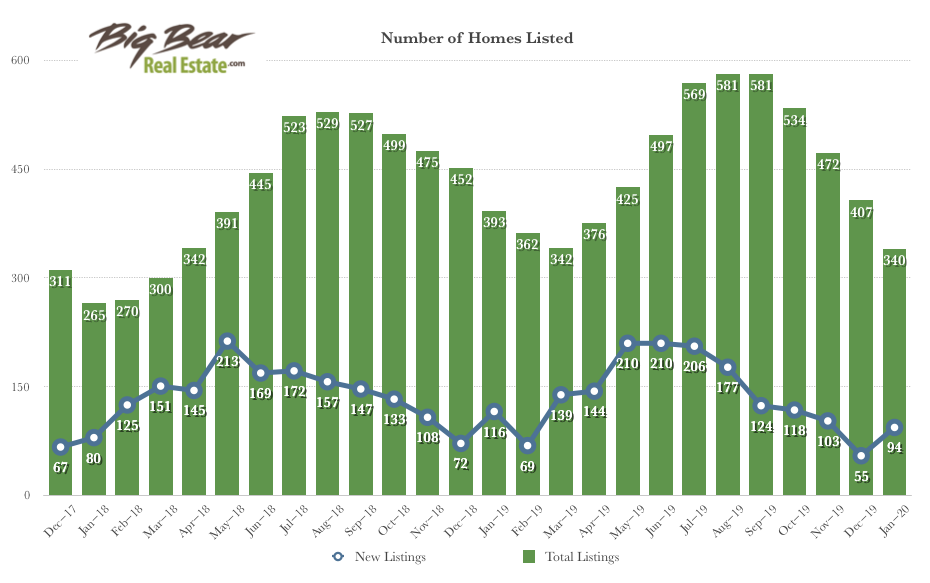
*Total listed inventory numbers as of the 15th of each month.
Closed Transactions
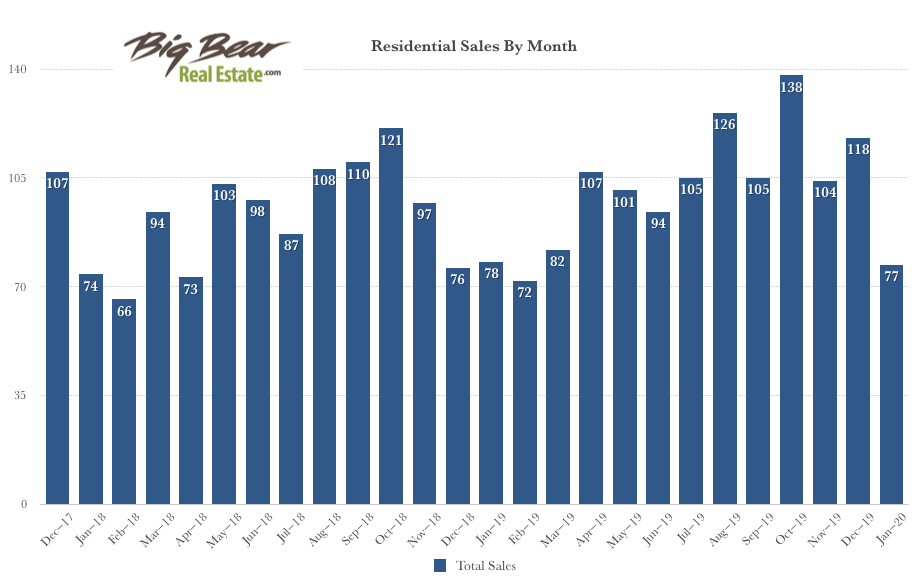
There were 77 sales in January, which was 35% less than the previous month, and only one fewer sale than in January 2019.
*Data derived from Big Bear Association of REALTORS®, Inc. (BBV) MLS. Information herein deemed reliable but not guaranteed.


Leave a Reply