Big Bear Real Estate Market Wide Summary – 2016
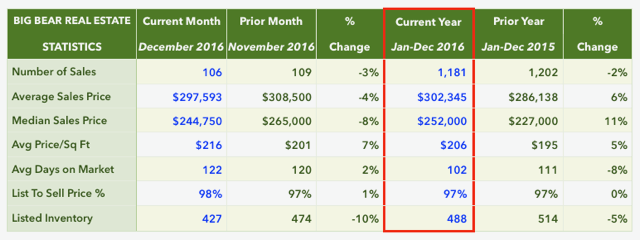
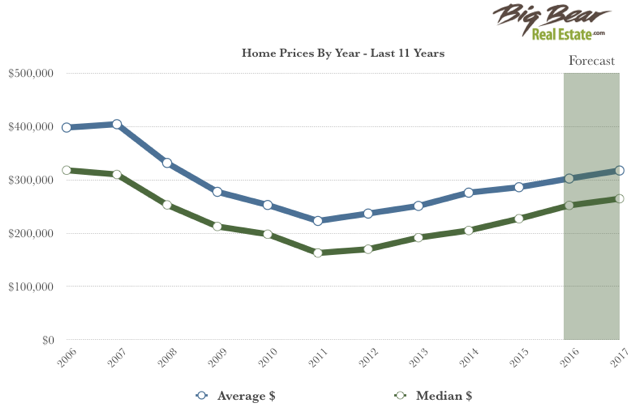
The Big Bear real estate market continued to have significant growth in 2016. The median sales price of single family homes increased by 11% compared to 2015. Average sales price increased 6%.
List Price vs. Sale Price and Days on Market
Properties sold in 2016 went for 97% of the asking price after 102 days on market on average, compared to 97% and 111 DOM in 2015.
Big Bear Inventory Trends
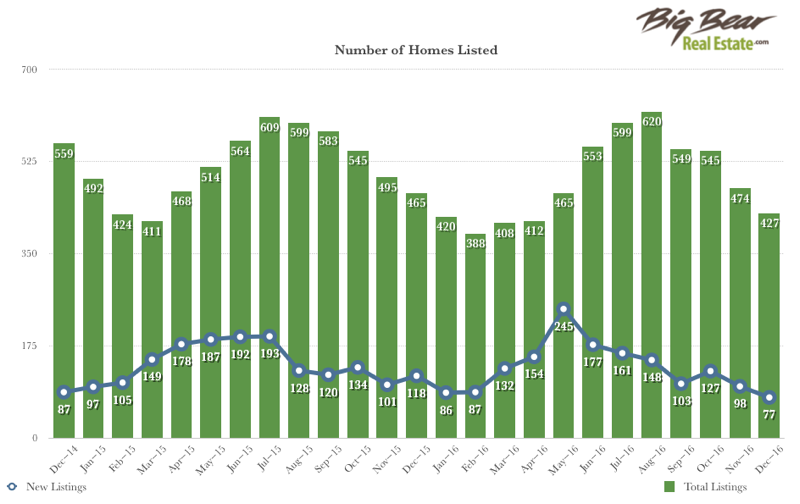
The total average inventory level decreased year over year, down 5% from 2015. The below graph shows average inventory and new listings by month over the past 2 years.
Closed Transactions
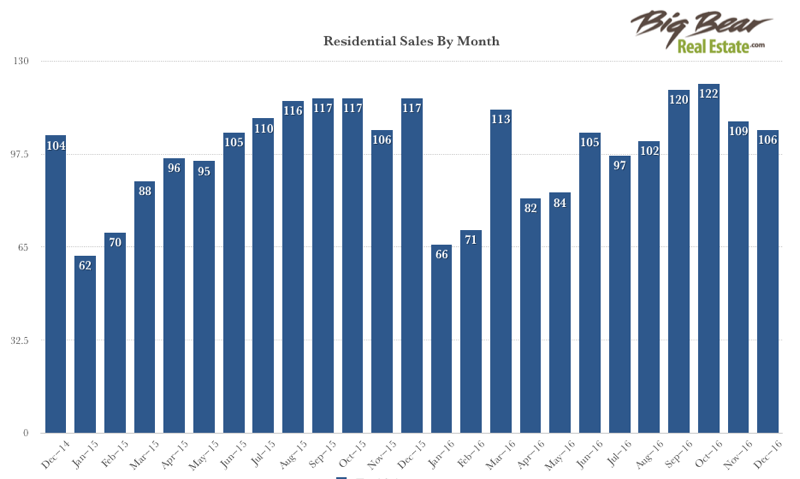
There were 1,181 sales in 2016, just a 2% decrease from the 1,202 transactions closed in 2015. The below graph shows sales over the past 2 years broken down by month.
Average Sold Price per Square Foot by Area
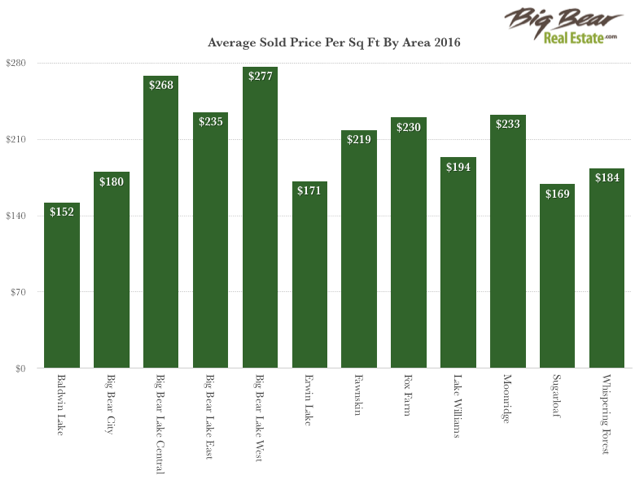
See below for a breakdown of average sold price per square foot by area. Big Bear Lake areas sold for the highest price per sq ft with Moonridge and Fox Farm coming in next.
Sold Price Range
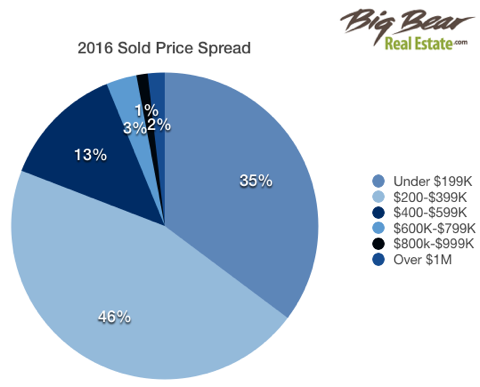
35% of homes sold went for under $199,000 market wide. 46% sold between $200-399K. Only 6% of homes sold for $600,000 or more.
Home Values in 2017
In 2016, average sales price increased from the prior year by about 6% market wide. Real estate data aggregator Zillow predicts that home values will rise another 5% within the next year. With relatively low inventory and increased demand, we could possibly see values go even higher in 2017.



Leave a Reply