Big Bear Real Estate Market Wide Summary – 2022
The Year in Review
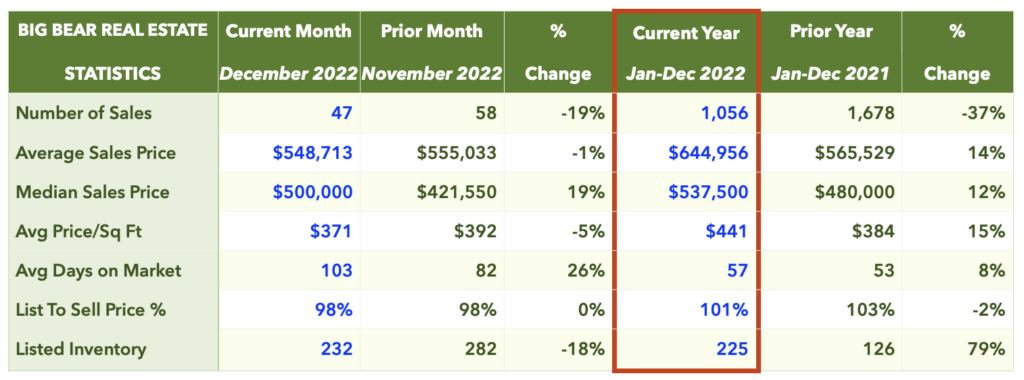
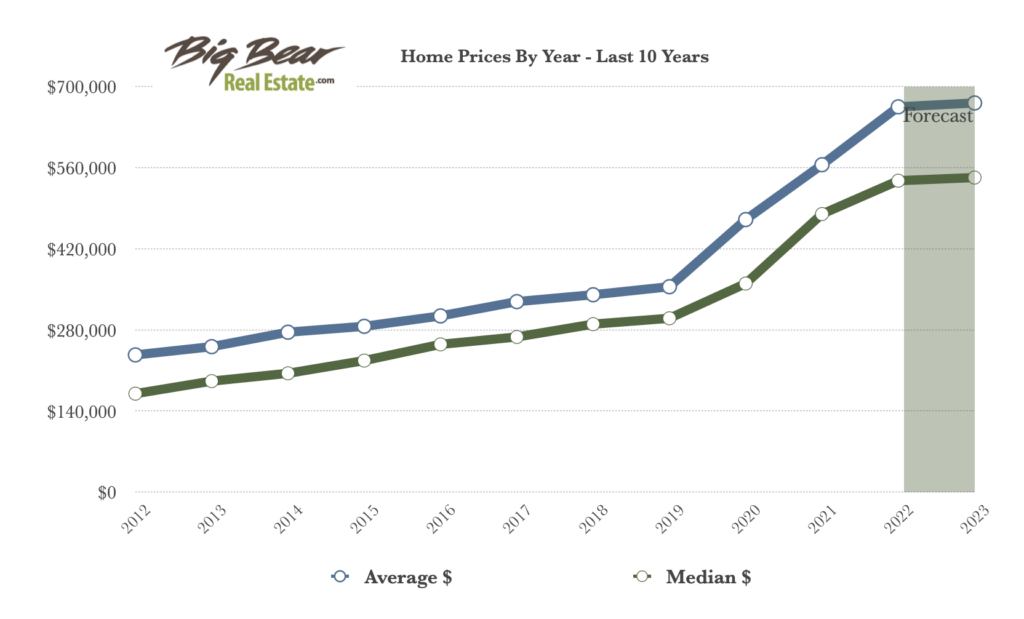
2022 was another interesting year for the Big Bear real estate market. Average sales price was up 14% compared to 2021, and average price per square foot was up 15%.
List Price vs. Sale Price and Days on Market
Properties sold in 2022 went for 101% of the asking price after 57 days on market on average, compared to 103% and 53 DOM in 2021.
Big Bear Inventory Trends
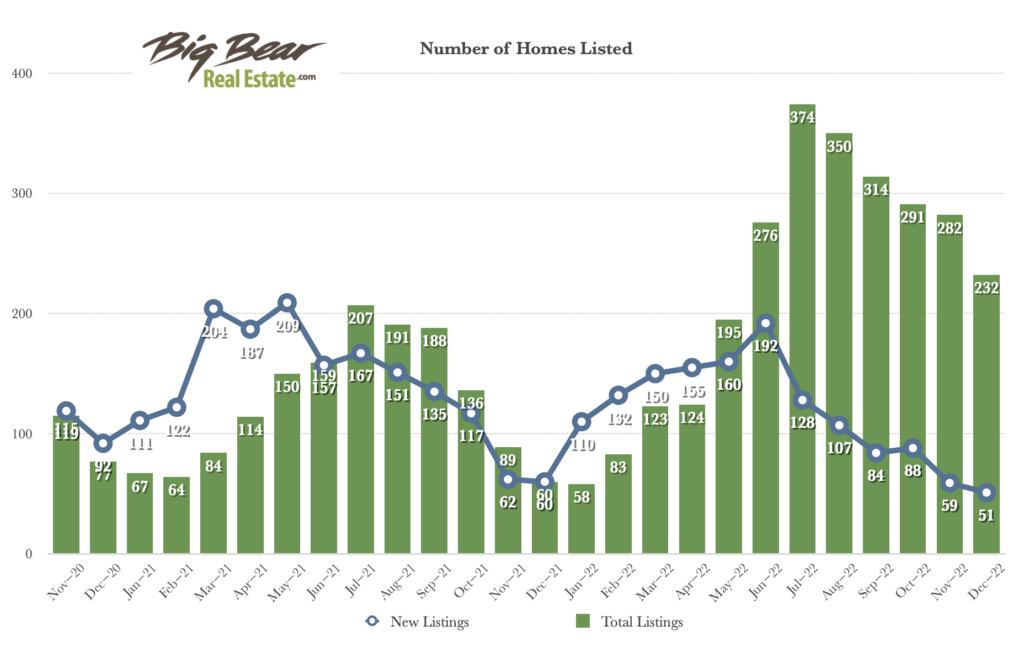
Inventory levels increased significantly in the second half of 2022. Total average inventory* over 2022 was up 79% from the year prior! The graph below shows average inventory and new listings by month over the past two years.
*Total listed inventory numbers as of the 15th of each month.
Closed Transactions
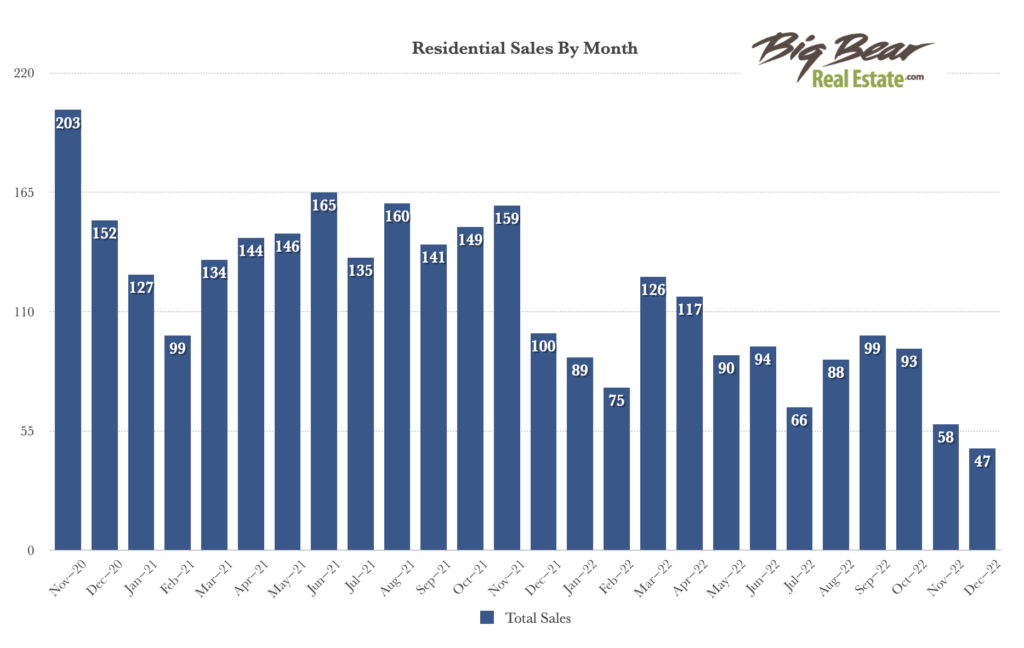
There were 1,056 sales in 2022, a 37% decrease over the 1,678 transactions closed in 2021. The graph below shows the number of sales over the past two years broken down by month.
Average Sold Price per Square Foot by Area
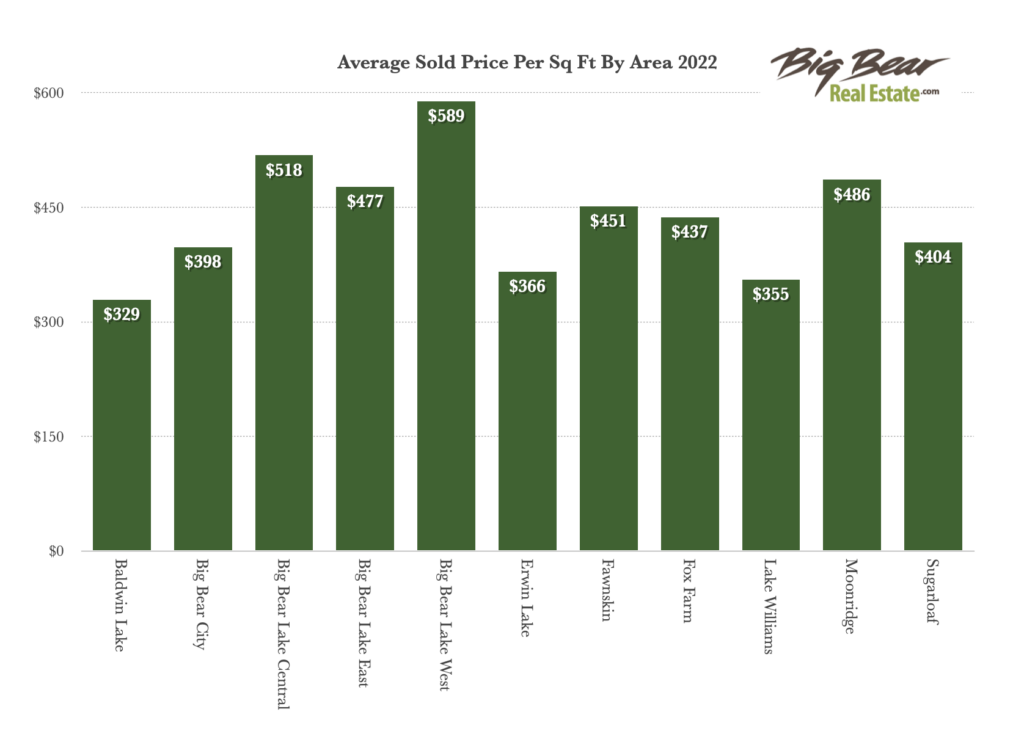
See below for a breakdown of average sold price per square foot by area. Big Bear Lake West sold for the highest price per sq ft at $589, with Big Bear Lake Central coming in next, and then Moonridge.
Sold Price Range
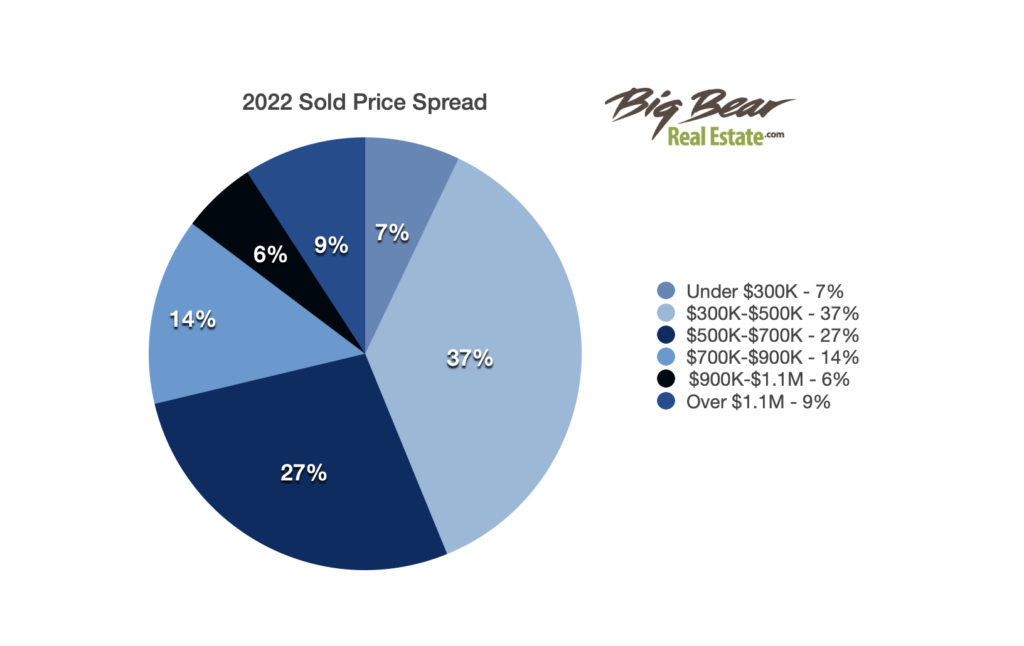
37% of homes sold in Big Bear went for between $300-500K in 2022. Only 7% sold for under $300,000. 29% of homes sold for $700,000 or more.
Home Values in 2022 and 2023
In 2022, the average sales price in Big Bear increased from the prior year by about 14% market wide. Zillow research predicts that home values in Big Bear Lake will rise a modest 1% over the next year.
*Data derived from Big Bear Association of REALTORS®, Inc. (BBV) MLS. Information herein deemed reliable but not guaranteed.



Leave a Reply