Big Bear Real Estate Market Wide Summary – 2020
The Year in Review
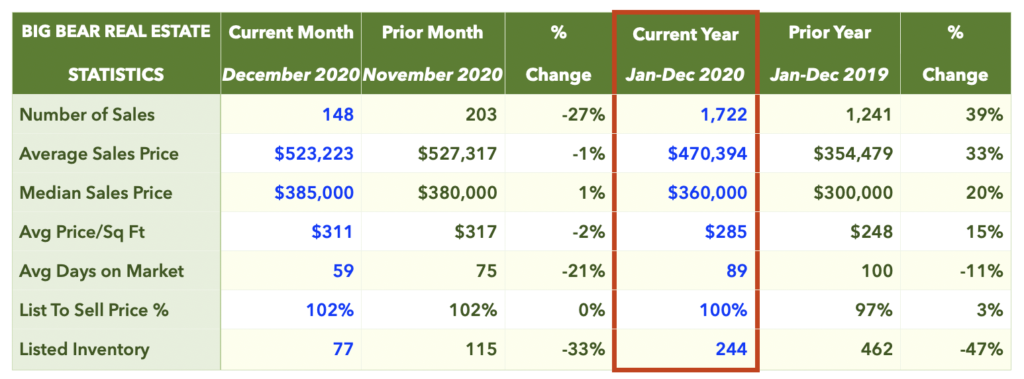
To say that 2020 was an unusual year for the Big Bear real estate market would be a gross understatement. There were 39% more sales transactions in 2020 than in 2019. Average sales price was up 33% and average price per square foot increased by 15%.
List Price vs. Sale Price and Days on Market
Properties sold in 2020 went for 100% of the asking price after 89 days on market on average, compared to 97% and 100 DOM in 2019.
Big Bear Inventory Trends
Inventory levels reached historic lows in 2020. Total average inventory* was down 47% from the year prior! The graph below shows average inventory and new listings by month over the past 2 years.
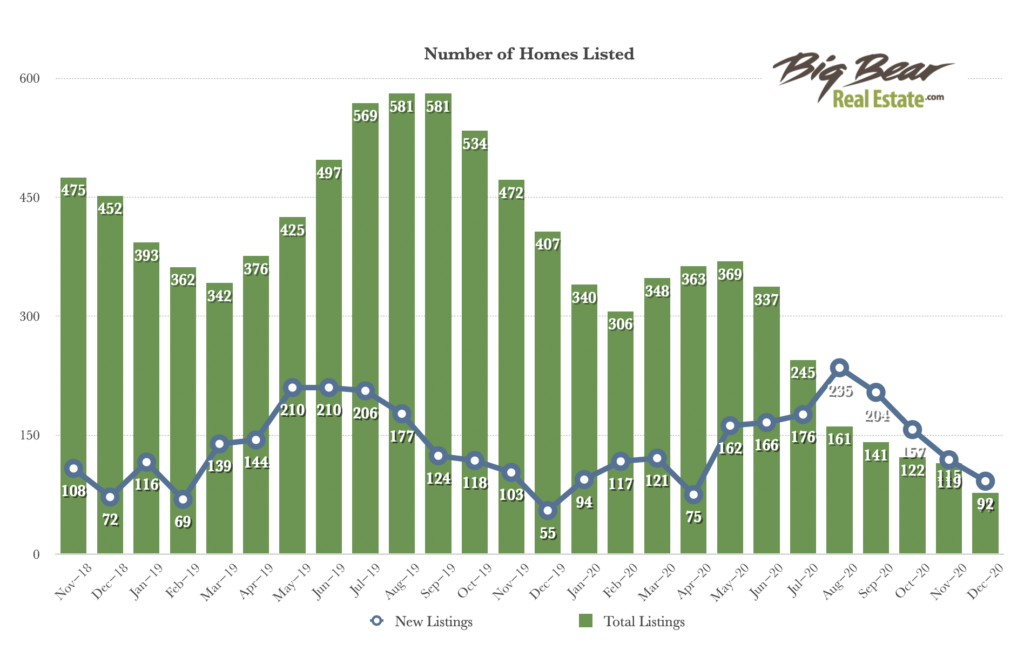 *Total listed inventory numbers as of the 15th of each month.
Closed Transactions
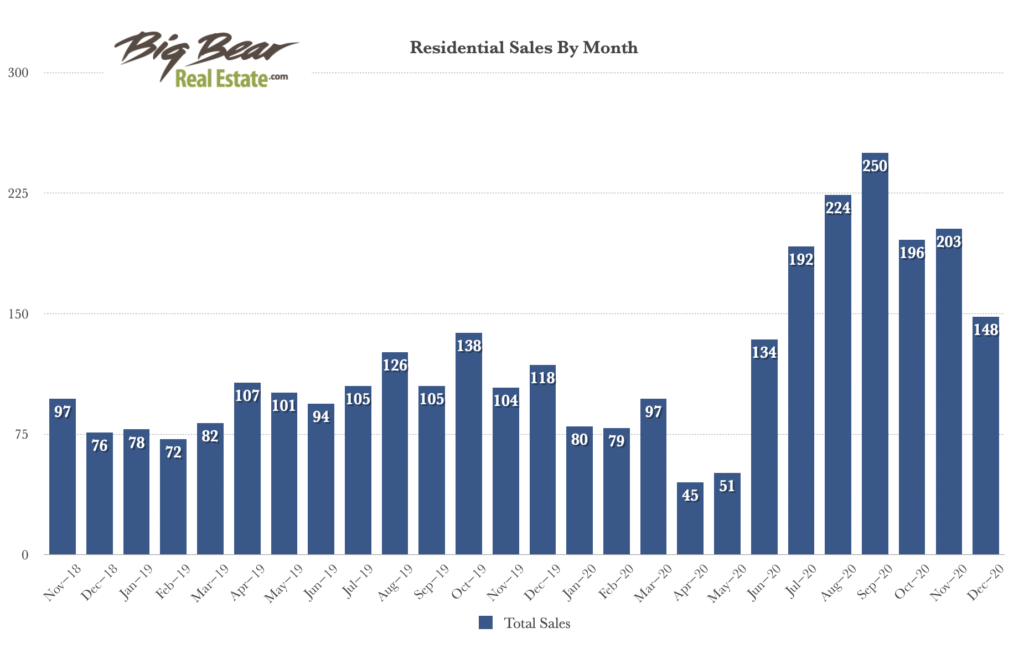
There were 1,722 sales in 2020, a nearly 40% increase over the 1,241 transactions closed in the prior year. The graph below shows the number of sales over the past 2 years broken down by month.
Average Sold Price per Square Foot by Area
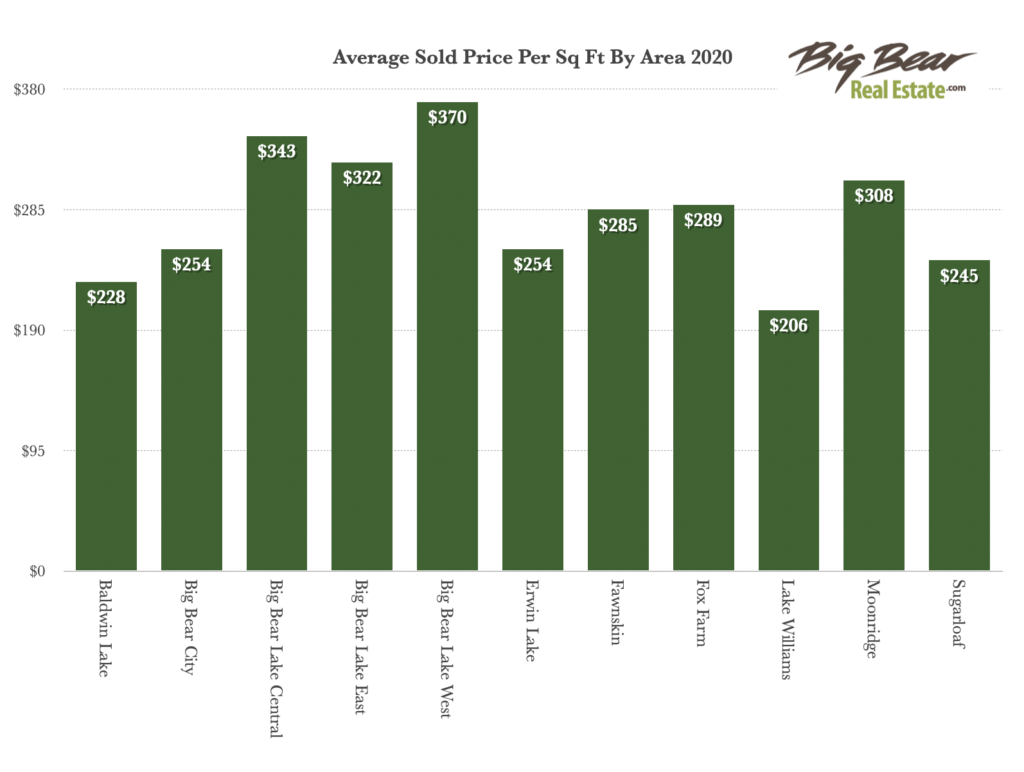
See below for a breakdown of average sold price per square foot by area. Big Bear Lake West sold for the highest price per sq ft at $370, with Big Bear Lake Central coming in next, then Big Bear Lake East and Moonridge.
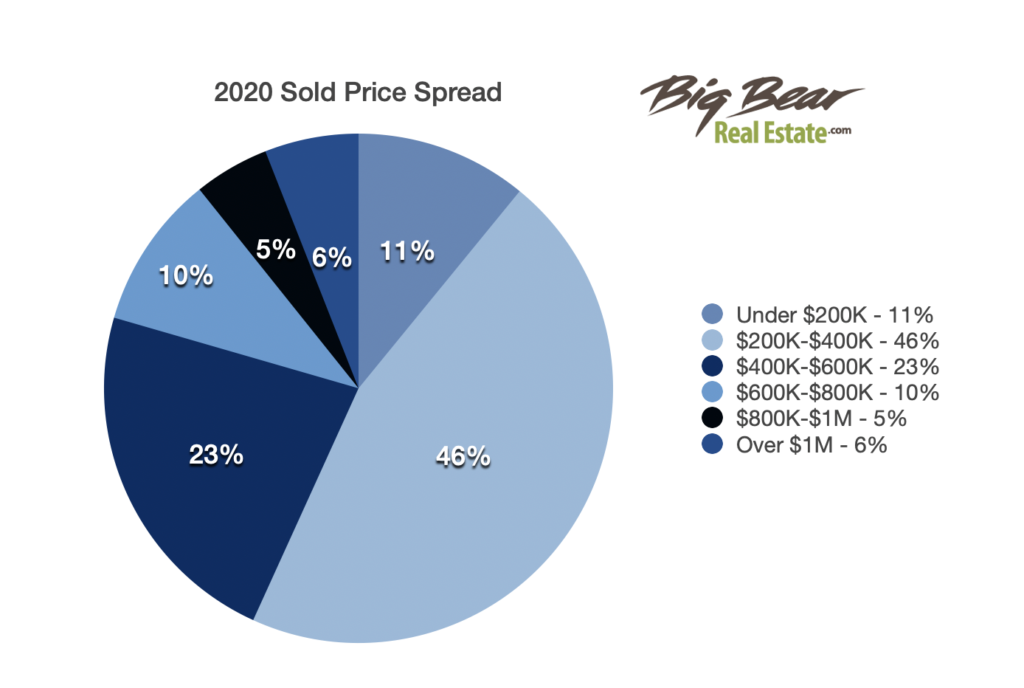
Sold Price Range
46% of homes sold in Big Bear went for between $200-400K in 2020. 11% sold for under $200,000. 21% of homes sold for $600,000 or more.
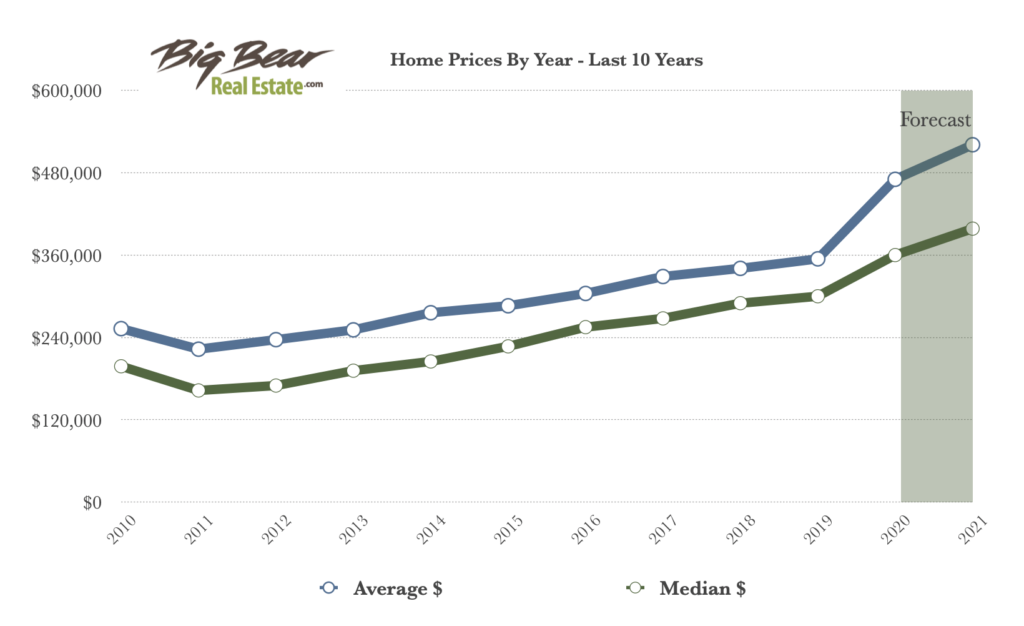
Home Values in 2020 and 2021
In 2020, the average sales price in Big Bear increased from the prior year by about 33% market wide. Zillow research predicts that home values in Big Bear Lake will rise another 10.7% over the next year.
 *Data derived from Big Bear Association of REALTORS®, Inc. (BBV) MLS. Information herein deemed reliable but not guaranteed.



Leave a Reply